New Feature Release: Dashboards, AI Charts & Other Updates!
Started by Heights Platform
1060 points
Heights Platform


Hey everyone,
We have some exciting updates in Heights Platform:
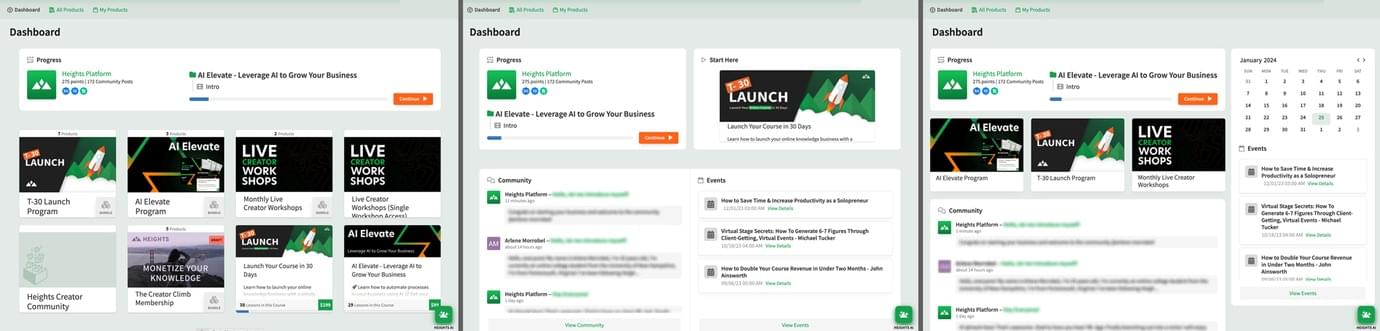
The new Student Dashboard is available to everyone: you can now completely change the look and feel of your main account home page (previously the "Courses" view). The Student Dashboard is the first view that your students see when they sign up or log in to your program. You can customize your dashboard to showcase your main products and courses, events, community posts, calendar and other custom information.
The dashboard can help you provide a better onboarding experience to new students, as well as introduce them to all the main products and events of your business, as students can understand at a glance where to start, how to access the community or keep updated on news and events.
Heights AI can now generate visual charts (pro plan only): When you chat with Heights AI, you can now ask it to generate visual charts for you! The AI can now generate charts for orders, sign-ups, enrollments, completions on lessons, and views on lessons.
Ask to generate a chart for a specific period of time or a custom range (up to 2 years back). Try asking, "Show me sign-ups for the last 6 months", or "How many people completed lessons from September 2023 until today?"…
Get reports and analytics from Coupon usage (pro plan only): You can now view reports of a coupon's usage over time and see a list of the redemptions for a given coupon. When viewing the reports on a coupon's detail page you have the option of exporting the report as a CSV. This makes it easy to track how many people are using your coupon codes!
What do you think about these updates? Let us know your thoughts here in the comments:

1060 points
Heights Platform
Hey everyone,
We have some exciting updates in Heights Platform:
The new Student Dashboard is available to everyone: you can now completely change the look and feel of your main account home page (previously the "Courses" view). The Student Dashboard is the first view that your students see when they sign up or log in to your program. You can customize your dashboard to showcase your main products and courses, events, community posts, calendar and other custom information.
The dashboard can help you provide a better onboarding experience to new students, as well as introduce them to all the main products and events of your business, as students can understand at a glance where to start, how to access the community or keep updated on news and events.
Heights AI can now generate visual charts (pro plan only): When you chat with Heights AI, you can now ask it to generate visual charts for you! The AI can now generate charts for orders, sign-ups, enrollments, completions on lessons, and views on lessons.
Ask to generate a chart for a specific period of time or a custom range (up to 2 years back). Try asking, "Show me sign-ups for the last 6 months", or "How many people completed lessons from September 2023 until today?"…
Get reports and analytics from Coupon usage (pro plan only): You can now view reports of a coupon's usage over time and see a list of the redemptions for a given coupon. When viewing the reports on a coupon's detail page you have the option of exporting the report as a CSV. This makes it easy to track how many people are using your coupon codes!
What do you think about these updates? Let us know your thoughts here in the comments:
1060 points
Heights Platform
For anyone who wants to catch up on updates from last year, we had hundreds of updates in 2023, and wrote about them here:
www.heightsplatform.comPreview is being generated. The full card will appear shortly.www.heightsplatform.com